Risk Areas for Property-related Crimes in Nan Municipality, Nan Province
Keywords:
Risk area of crime, Property theft, Spatial distributionAbstract
Crime is a significant problem in Thailand, leading to damages to both life and property. The highest incidence of criminal cases occurs in the Nan municipality, Nan Province, particularly in cases of theft. The objectives of this research are as follows: 1) to study the spatial distribution patterns of areas at risk for property-related crimes, 2) to analyze the patterns of relationships contributing to property-related crimes and 3) to examine the directional trends in the spatial distribution of property-related crimes. The study aimed to examine property crime incidents from the year 2018 to 2022 using Kernel Density estimation to illustrate the risk levels of property crime occurrences. Additionally, it aimed to analyze the relationship between high-risk areas and physical factors such as population density, land use, road networks, and police stations using the Getis-Ord Gi* method. Furthermore, the study investigated the trends and directions of crime distribution using the Standard Deviational Ellipse (SDE) method.
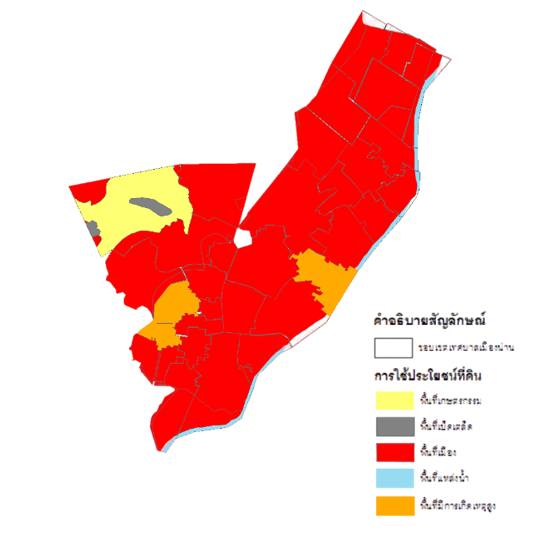
The study found that property crime incidents exhibited a dispersed pattern with varying risk levels. Areas at risk of property crimes are divided into areas with high, medium, low risk and no risk areas. which can be displayed in the colors on the map as red, orange, yellow and green, respectively. Green areas indicated low or no risk, where property crime incidents were absent. Analysis using the Getis-Ord Gi* method revealed that areas with high population density, urban areas, and secondary road networks posed higher risks for incidents. The findings of this study can be utilized to inform planning and surveillance efforts by law enforcement agencies or relevant organizations in preventing property crime occurrences.
References
จิรัติวัล เครือศิลป์. (2549). ระบบสารสนเทศภูมิศาสตร์เพื่อกำหนดพื้นที่เสี่ยงต่อการเกิดโรคไข้เลือดออกในจังหวัดนครราชสีมา. กรุงเทพฯ: สาขาวิชาภูมิศาสตร์ คณะอักษรษศาสตร์ จุฬาลงกรณ์มหาวิทยาลัย.
ทวีเกียรติ มีนะกนิษฐ. (2544). คำอธิบายกฎหมายอาญาภาคความผิดและลหุโทษ. กรุงเทพฯ: สำนักพิมพ์วิญญูชนจำกัด.
ธีรไนย ศรีธรรมรงค์. (2559). การประเมินพื้นที่เสี่ยงการเกิดอาชญากรรมด้วยการวิเคราะห์สถิติเชิงพื้นที่. กรุงเทพฯ: สาขาวิชาวิทยาศาสตร์สิ่งแวดล้อม มหาวิทยาลัยศิลปากร.
ปิยะชัย ถิ่นไทยงาม. (2560). พื้นที่เสี่ยงของอาชญากรรมที่เกี่ยวกับทรัพย์ในอำเภอเมือง จังหวัดพิษณุโลกในอำเภอเมืองจังหวัดพิษณุโลก. พิษณุโลก: สาขาวิชาภูมิศาสตร์ คณะเกษตรศาสตร์ทรัพยากรธรรมชาติและสิ่งแวดล้อม มหาวิทยาลัยนเรศวร.
พัทธนันท์ รัตนวรเศวต. (2562). วิเคราะห์พื้นที่เสี่ยงต่อการเกิดอาชญากรรมด้วยระบบสารสนเทศภูมิศาสตร์. กรุงเทพฯ: คณะมนุษยศาสตร์และสังคมศาสตร์ มหาวิทยาลัยราชภัฏจันทรเกษม.
พรชัย ขันตี. (2553). ทฤษฎีอาชญาวิทยา: หลักการ งานวิจัย และนโยบายประยุกต์. กรุงเทพฯ: สุเนตร์ฟิล์ม.
มณฑล เยี่ยมไพศาล และมานัส ศรีวณิช. (2553). ความหนาแน่นเชิงพื้นที่อาชญากรรม กรณีศึกษาเขตพระนคร กรุงเทพมหานคร ศึกษาตามแบบเคอร์เนล. กรุงเทพฯ: คณะสถาปัตยกรรมศาสตร์และการผังเมืองมหาวิทยาลัยธรรมศาสตร์.
สิทธิณัฐ มนเทียรอาสน์ และ พลภัทร เหมวรรณ. (2563). แบบจำลองเชิงคาดการณ์อาชญากรรมในเขตพื้นที่รับผิดชอบสถานีตำรวจภูธรช้างเผือก จังหวัดเชียงใหญ่. เชียงใหม่: คณะสังคมศาสตร์ มหาวิทยาลัยเชียงใหม่.
สุดสงวน สุธีสร. (2547). อาชญาวิทยา (พิมพ์ครั้งที่ 2). กรุงเทพฯ: สำนักพิมพ์ มหาวิทยาลัยธรรมศาสตร์
สุวัฒน์ ศรีพงษ์สุวรรณ. (2549). คำอธิบายประมวลกฎหมายอาญา (พิมพ์ครั้งที่ 4). กรุงเทพฯ: สำนักพิมพ์นิติบรรณการ.
สำนักงานประชาสัมพันธ์จังหวัดน่าน (2566). จังหวัดน่าน จัดพิธีปล่อยแถวระดมกวาดล้างอาชญากรรมและอำนวยความสะดวกด้านการจราจร. จาก https://radionan.prd.go.th/th/content/category/detail/id/6/iid/245337.
Getis, A. 2007. Reflections on spatial autocorrelation. Regional Science and Urban Economics, 37(2), 491–496.
Jeefoo, P. (2014). Analysis of Spatial Pattern of Diarrhea Incidence Based on Spatial Autocorrelation Statistics in Phayao Province, Thailand. KKU Sci. J., 42(2), 449-462.
Peeters, A., M. Zude, J. Kathner, M. Unlu, R. Kanber, A. Hetzroni, R. Gebbers andA.Ben-Gal. (2014). Getis–Ord’s hot- and cold-spot statistics as a basis formultivariate spatial clustering of orchard tree data. Computers and Electronics in Agriculture, 111, 140-150.