
Performance comparison of TEWMA-Max and GWMA-Max control chart under Weibull distribution
Article Sidebar
Main Article Content
Abstract
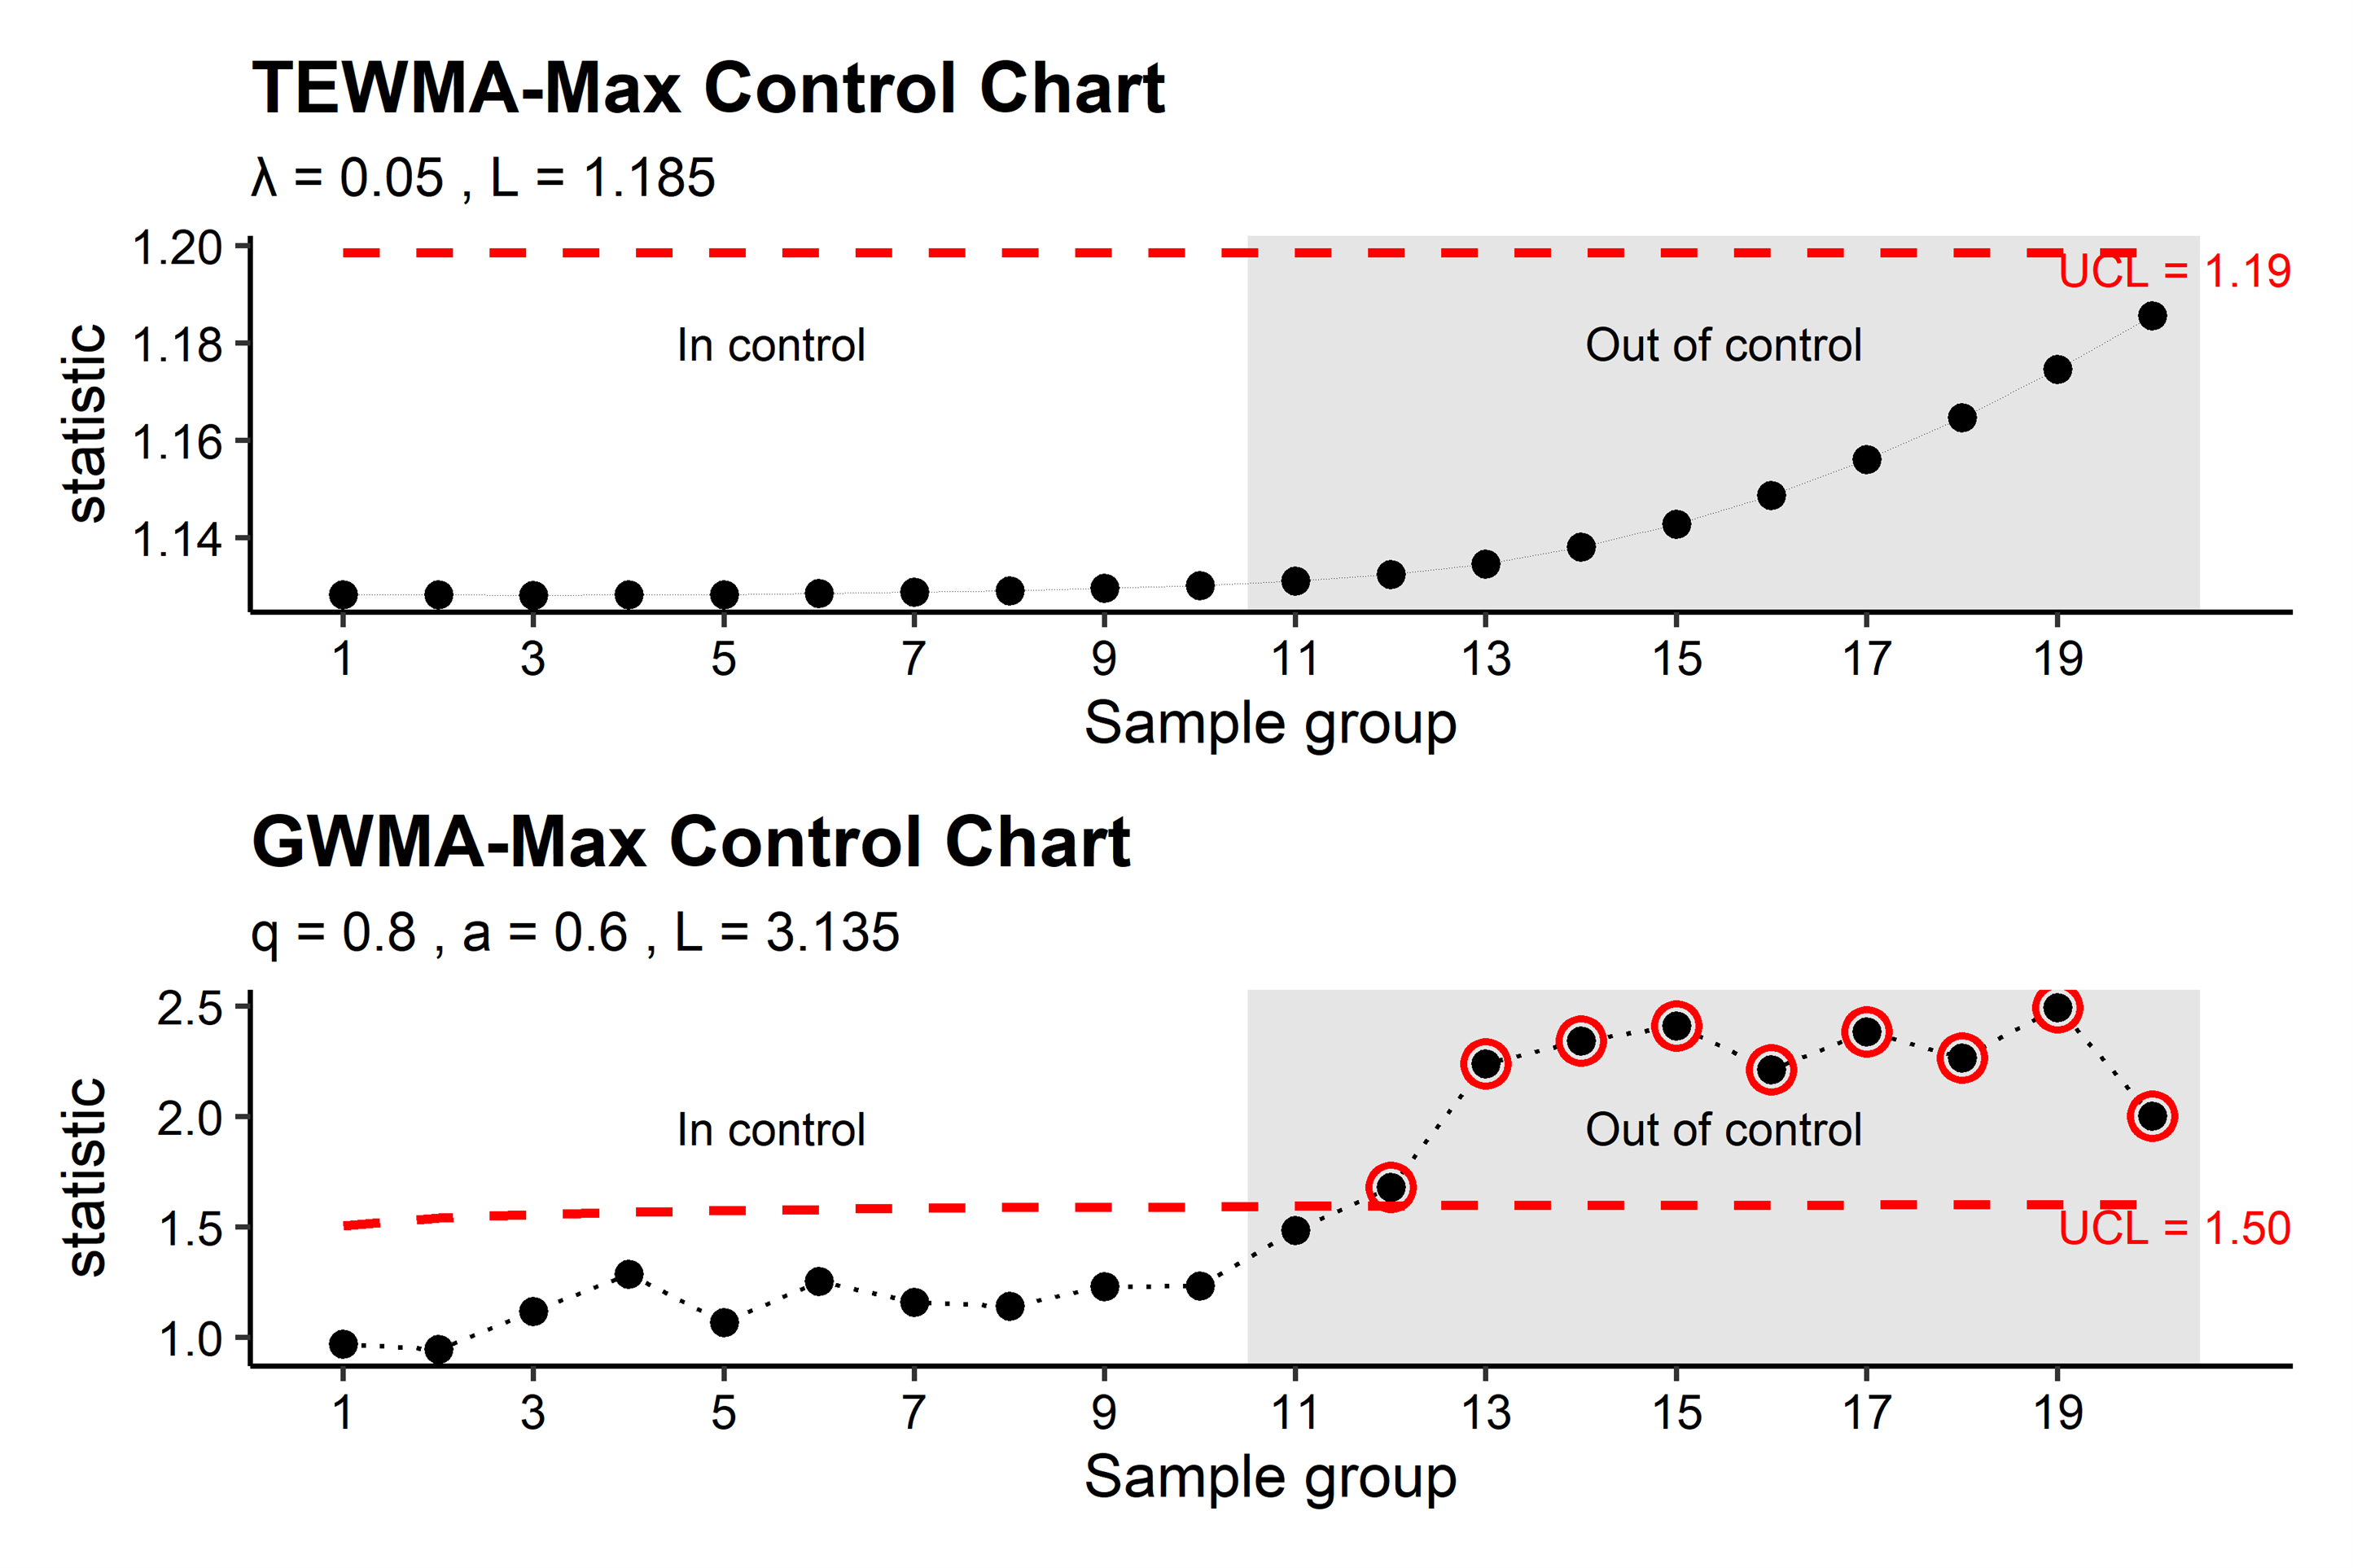
This study aims to compare the performance of the TEWMA-Max and GWMA-Max control charts in detecting changes in the process mean and variability under data following a Weibull distribution, which reflects real-world manufacturing processes that often deviate from the normality assumption. Both control charts are developed based on the concept of the Max control chart, where the TEWMA-Max chart employs a triple-layer exponential weighting scheme, while the GWMA-Max chart adopts a more flexible generalized weighting structure. To satisfy the normality assumption underlying these control charts, data generated from the Weibull distribution were transformed to approximate a standard normal distribution using the inverse transform method. A Monte Carlo simulation was then conducted under the in-control condition
and under various out-of-control conditions resulting from changes in
and
. Three types of process shifts were considered: mean shift (MS), variance shift (VS), and simultaneous mean and variance shift (MVS). The results indicate that the GWMA-Max chart yields lower
values than the TEWMA-Max chart in most scenarios, particularly in the MS and MVS cases, indicating a faster detection of process changes. However, the performance of both charts decreases when only variance shifts occur (VS case), which is consistent with the inherent characteristic of Max-Type control charts that are generally more sensitive to mean shifts than to variance shifts.
Article Details

This work is licensed under a Creative Commons Attribution-NonCommercial-NoDerivatives 4.0 International License.
References
Chen, G. and Cheng, S.W. (1998). Max chart: Combining X-Bar chart and S chart. Statistica Sinica 8: 263 - 271.
Chen, G., Cheng, S.W. and Xie, H. (2001). Monitoring Process Mean and Variability with One EWMA Chart. Journal of Quality Technology 33(2): 223 - 233. doi: 10.1080/00224065.2001.11980069.
Chatterjee, K., Koukouvinos, C. and Lappa, A. (2023a). A joint monitoring of the process mean and variance with a TEWMA-Max control chart. Communication in Statistics - Theory and Methods 52(22): 8069 - 8095. doi: 10.1080/03610926.2022.2056748.
Chatterjee, K., Koukouvinos, C., Lappa, A. and Roupa, P. (2023b). A joint monitoring of the process mean and variance with a generally weighted moving average maximum control chart. Communications in Statistics - Simulation and Computation 53(11): 5122 - 5142. doi: 10.1080/03610918.2023.2170415.
Faraz, A., Saniga, E.M., and Heuchenne, C. (2015). Shewhart Control Charts for Monitoring Reliability with Weibull Lifetimes. Quality and Reliability Engineering International 31(8): 1565 - 1574. doi: 10.1002/qre.1692.
Noor-ul-Amin, M., Aslam, I. and Feroze, N. (2023). Joint monitoring of mean and variance using Max-EWMA for Weibull process. Communications in Statistics-Simulation and Computation 52(7): 3257 - 3272. doi: 10.1080/03610918.2021.1931322.
Padgett, W.J. and Spurrier, J.D. (1990). Shewhart-type charts for percentiles of strength distributions. Journal of Quality Technology 22(4): 283 - 288. doi: 10.1080/00224065.1990.11979260.
Wang, F.K. (2017). MaxEWMA control chart for a Weibull process with individual measurements. Quality and Reliability Engineering International 33(2): 369 - 379. doi: 10.1002/qre.2013.
Xie, H. (1999). Contributions to qualimetry. Ph.D. dissertation, University of Manitoba, Winnipeg, Canada: 162 pp.
Yin, T.S., Khoo, M.B. and Kit, L.C. (2010). Comparing the performances of the Optimal SS-DEWMA and Max-DEWMA Control Charts. Journal of Statistical Modelling and Analytics 1(2): 1 - 9.
