A Comparison of the Efficiency of the HEWMA THWMA and DMEWMA Control Chart for 3 Parameter Gamma Distribution
Keywords:
Hybrid exponentially weighted moving average, Triple homogeneously weighted moving average, Double-modified exponentially weighted moving average, Average run lengthAbstract
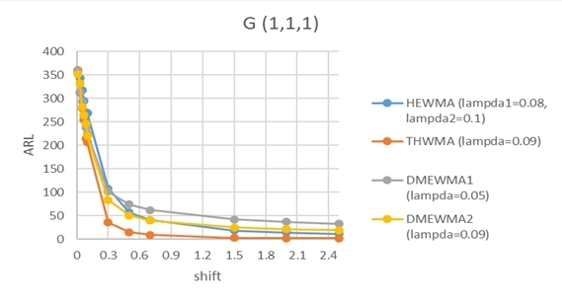
The purpose of this research was to compare the performance of the three control chart types: The Hybrid Exponentially Weighted Moving Average Control Chart (HEWMA), Triple Homogeneously Weighted Average Control Chart (THWMA) and Double Exponential Weighted Average Control Chart (DMEWMA) by detecting shift in size of the shape parameter of the process in which the data has a 3-parameter gamma distribution.simulating the data studied by the Monte Carlo Method in which each situation was repeated 10,000 cycles by specifying the shape parameter, scale parameter,location parameter amd the smoothing parameters of the HEWMA control chart were set to 0.05, 0.08 and 0.1, 0.3, 0.5 THWMA control chartis 0.03, 0.07, 0.09, 0.1, 0.2, 0.5 and DMEWMA control chart is 0.03, 0.05, 0.07, 0.09, 0.2, 0.5. Process variation shift size () is 0.01, 0.03, 0.05, 0.07, 0.09, 0.1, 0.3, 0.5, 0.7, 1.5, 2 and 2.5. The criteria for the control chart's performance is determined by its average run length (ARL), where the most efficient control chart gave the least average run length when the process was out of control. THWMA control charts the best monitor shift of parameter and as the size increases the THWMA control chart performs similarly to the DMEWMA1 and DMEWMA2 control charts if the shift is large. The HEWMA control chart will give you the best performance.
References
Abbas, N. (2018). Homogeneously weighted moving average control chart with an application in substrate manufacturing process. Computers & Industrial Engineering,120, 460-470. https://doi.org/10.1016/j.cie.2018.05.009
Abid, M., Shabbir, A., Nazir, H.Z., Sherwani, R.A.K., & Riaz, M. (2020). A double homogeneously weighted moving average control chart for monitoring of the process mean. Quality and Reliability Engineering, 36(178), 1513–1527. https://doi.org/10.1002/qre.2641
Alevizakos, V., Chatterjee, K.,& Koukouvinos, C. (2021). Modified EWMA and DEWMA control charts for process monitoring. Communications in Statistics-Theory and Methods, 1–25, https://doi.org/10.1080/03610926.2021.1872642
Alkahtani, S.S. (2013). Robustness of DEWMA versus EWMA Control Charts to Non-Normal Processes. Journal of Modern Applied Statistical Methods, 12(1), 148-163.
Aksoy, H. (2000). Use of gamma distribution in hydrological analysis. Turkish Journal of Engineering & Environmental Sciences, 24, 419-428.
Bhaumik, D.K. & Gibbons, R.D. (2006). One-sided approximate prediction intervals for at least p of m observations from a gamma population at each of r locations. Technometrics, 48(1), 112-119. https://doi.org/10.10198/004017005000000355
Haq, A. (2013). A new hybrid exponentially weighted moving average control chart for monitoring process mean. Quality and Reliability E n g i n e e r i n g I n t e r n a t i o n a l , 2 9( 7 ) , 1 0 1 5–1 0 2 5 . h t tp : / / d o i . o r g /10.1002/qre.1453
Haq, A. (2017). A new hybrid exponentially weighted moving average control chart for monitoring process mean: discussion. Quality and Reliability Engineering International. 33(7), 1629–1631. https://doi.org/10.1002/qre.2092
Khan, N., Aslam, M., Ahmad, L., & Jun, C.-H. (2017). A Control Chart for Gamma Distributed Variables Using Repetitive Sampling Scheme. Pakistan Journal of Statistics and Operation Research, 13(1), 47-61. http://dx.doi.org/10.108187/pjsor.v13i1.1390
Lakshmi, R.V.,& Vaidyanathan, V.S. (2016). Three-Parameter Gamma Distribution: Estimation Using Likelihood, Spacings and Least Squares Approach. Journal of Statistics and Management Systems, 19(1), 37-53.https://doi.org/10.1080/09720510.2014.986927
Montgomery, D. C. (2012). Introduction to statistical quality control(7thed.), New York, NY: Wiley.
Nazir, H.Z., Riaz, M., Does, R.J.M.M.,& Abbas, N. (2013). Robust CUSUM control charting. Quality Engineering, 25(3), 211–224. https://doi.org/10.1080/08982112.2013.769057
Page, E. S. (1954). Continuous inspection schemes. Biometrika, 41(1), 100-115.
Riaz, M., Abbas, Z., Nazir, H.Z., & Abid, M. (2021). On the Development of Triple Homogeneously Weighted Moving Average Control Chart. Symmetry,13(2), 1-21. https://doi.org/10.3390/sym13020360
Robert, S. W. (1959). Control Chart Test Based on Geometric Moving Averages. Technometrics, 1, 239-250.
Saeed, N., & Kamal, S. (2016). The EWMA control chart based on robust scale estimators. Pakistan Journal of Statistics and Operation Research, 12(4), 659-672. https://doi.org/10.108187/pjsor.v12i4.1475
Shewhart, W.A.(1931). Economic Control of Quality of Manufacturing Product. New York, USA: Van Nostrand.
Downloads
Published
License
Copyright (c) 2023 Journal of Applied Science and Emerging Technology

This work is licensed under a Creative Commons Attribution-NonCommercial-NoDerivatives 4.0 International License.

