Efficiency comparison of TEWMA FIR-TEWMA MFIR-TEWMA QEWMA FIR-QEWMA and MFIR-QEWMA control charts for Lognormal distribution
Keywords:
TEWMA, QEWMA, Fast Initial Response, Average Run LengthAbstract
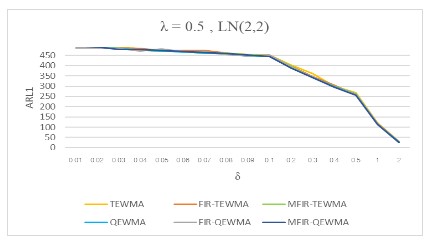
This research aimed to compare efficiency of Triple Exponentially Weighted Moving Average Control Chart (TEWMA) and Quadruple Exponentially Weighted Moving Average Control Chart (QEWMA). In addition, it had techniques of Fast Initial Response (FIR) and Modified Fast Initial Response (MFIR) applied to Triple Exponentially Weighted Moving Average Control Chart (TEWMA) and Quadruple Exponentially Weighted Moving Average Control Chart (QEWMA) so as to detect a change of Location Parameter: µ. It was operated by simulating data through Monte Carlo Method repeating 10,000 rounds. Moreover, data was determined to be distributed in form of Log normal distribution while Location Parameter was 1,2,3,7, and 15, and Scale Parameter was 1 and 2 respectively. Meanwhile, Smoothing Parameter of total control chart was determined as 0.1, 0.3, and 0.5 while the ship size of processwas from 0.01 to 2. What’s more, the criteria used for measuring efficiency of Control chart took into account Average Run Length. In this way, Control chart with utmost efficiency yielded the least Average Run Length when the process was out of control. According to research findings, it appeared that increasing technique of Fast Initial Response and technique of making Control chart flat led Control chart to yield similar efficiency.
References
Alevizakos, V., Chatterjee, K., & Koukouvinos, C. (2021). The triple exponentially weighted moving average control chart.Quality Technology & Quantitative Management,18(3), 326-354. http://dx.doi.org/10.1080/16843703.2020.1809063
Alevizakos, V., Chatterjee, K., & Koukouvinos, C. (2022). The quadruple exponentially weighted moving average control chart.Quality Technology & Quantitative Management,19(1), 50-73. http://dx.doi.org/10.1080/16843703.2021.1989141
Ferrell, E. D. (1958). Control charts for lognormal universe. Industrial Quality Control, 15, 4–6.
Haq, A., Brown, J., & Moltchanova, E. (2014). Improved fast initial response features for exponentially weighted moving average and cumulative sum control charts.Quality and Reliability Engineering International,30(5), 697-710. http://dx.doi.org/10.1002/qre.1521
Huang, W.H.(2021).Control Charts for Joint Monitoring of the Lognormal Mean and Standard Deviation.Symmetry.13(4),1-28. https://doi.org/10.3390/sym13040549
Huang, W. H., Yeh, A. B., & Wang, H. (2018). A control chart for the lognormal standard deviation.Quality Technology & Quantitative Management,15(1), 1-36. https://doi.org/10.1080/16843703.2017.1304044
Huang, W. H., Wang, H., & Yeh, A. B. (2016). Control charts for the lognormal mean.Quality and Reliability Engineering International,32(4), 1407-1416. https://doi.org/10.1002/qre.1841
Pobočíková, I., Sedliačková, Z., Michalková, M., & Kuchariková, L. (2019). Monte Carlo comparison of estimation methods for the two-parameter lognormal distribution. InMATEC Web of Conferences. https://doi.org/10.1051/matecconf/201925408002
Montgomery, D. C.(2012),Introduction to statistical quality control.7thed., New York.Wiley.
Morrison, J. (1958). The lognormal distribution in quality control.Journal of the Royal Statistical Society: Series C (Applied Statistics),7(3), 160-172.
Page,E. S. (1954).Cumulative Sum Control Chart. Technometrics,3, 1-9.
Roberts,S.W.(1959).Control chart tests based on geometric moving averages. Technometrics, 1(3), 239–250.
Shamma, S. E. & Shamma, A.K.(1992).Development and evaluation of control charts usingdouble exponentially weighted moving averages. International Journal of Quality & Reliability Management. 9(6),18-25, https://doi.org/10.1108/02656719210018570
Shewhart, W.A. (1932). Economic control of quality of manufactured product. Van Nostrand.
Steiner, S. H. (1999). EWMA control charts with time-varying control limits and fast initial response.Journal of Quality Technology,31(1), 75-86.http://dx.doi.org/10.1080/00224065.1999.11979899.
Downloads
Published
License
Copyright (c) 2024 Journal of Applied Science and Emerging Technology

This work is licensed under a Creative Commons Attribution-NonCommercial-NoDerivatives 4.0 International License.

