The Performance of DEWMA and EWMA for ZIB Model when Underlying Distribution is the Ratio of Two Poisson Means
Keywords:
Average Run Length, zero-inflated binomial, Markov Chain, double exponentially weighted moving averageAbstract
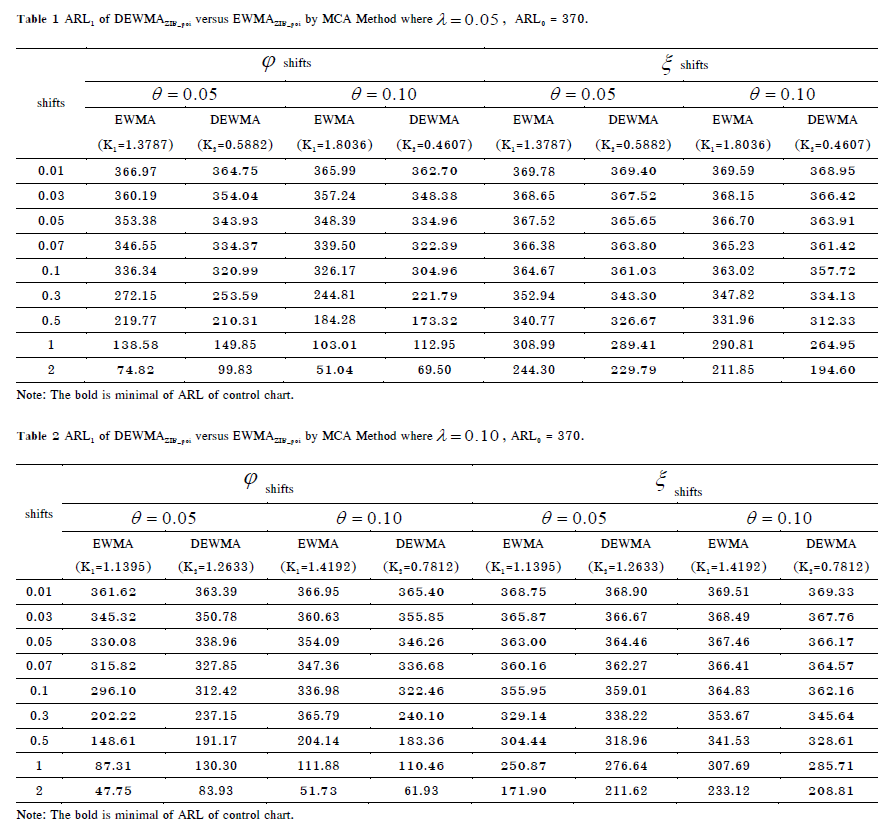
This research aims to present a double exponent weighted moving average (DEWMA) control chart for a Zero Inflated Binomial model under the ratio distribution of the two Poisson means (ZIBpoi) by the Markov Chain approach, this is also to compare the efficiency of DEWMA with EWMA procedure. The performance of DEWMA control chart gives an out-of-control signal quicker than EWMA control chart to small process shifts () for
shifts and quicker than all cases for
shifts.
References
Alkahtani, S. (2013). Robustness of DEWMA versus EWMA control charts to non-normal processes. Journal of Modern Applied Statistical Methods, 12(1). 148-163. https://doi.org/10.22237/jmasm/1367381820
Bualuang, D., Areepong, Y., &Sukparungsee, S. (2017). ARL formulas of MA control chart with zero-inflated Binomial model when underlying distribution is ratio of two Poisson means. In Proceedings of the International MultiConference of Engineers and Computer Scientists(pp. 292-298).Hong Kong.
Calzada, M. E., & Scariano, S. M. (2003). Reconciling the integral equation and markov chain approaches for computing EWMA average run lengths. Communications in Statistics -Simulation and Computation, 32(2), 591-604. https://doi.org/10.1081/SAC-120017508
Chananet, C., Sukparungsee,S., & Areepong,Y., (2014). The ARL of EWMA chart of monitoring ZINB model using markov chain approach. International Journal of Applied Physics andMathematics, 4,236-239. https://doi.org/10.7763/IJAPM.2014.V4.290
Douglas, C. M. (2005). Introduction to Statistical Quality Control(5thed.).John Wiley & Son.
Lucas, J. M., & Saccucci, M. S. (1990). Exponentially weighted moving average control schemes: Properties and Enhancements. Technometrics, 32, 1–12.
Mahmoud, M. A., & Woodall, W. H.(2010). An evaluation of the double exponentially weighted moving average control chart. Communications in Statistics –Simulation and Computation, 39(5), 933-949.https://doi.org/10.1080/03610911003663907
Noorossana, R., Fatahi, A. A., Dokouhaki, P., & Babakhani, M. (2011). ZIB-EWMA control chart for monitoring rare health events. Journal of Mechanics in Medicine and Biology, 11. https://doi.org/10.1142/S0219519411004125
Page, E. S. (1954). Continuous inspection schemes. Biometrika,41, 100-114.
Petcharat, K., Sukparungsee, S., & Areepong, Y. (2015). Exact solution of the average run length for the cumulative sum chart for a moving average process of order q. ScienceAsia, 41,141-147. https://doi.org/10.2306/scienceasia1513-1874.2015.41.141
Phantu, S., & Sukparungsee, S. (2020). A mixed double exponentially weighted moving average -Tukey’s control chart for monitoring ofparameter change. Thailand Statistician, 18(4), 392-402.
Rafael, P. A., &Jay, R. S. (2017). A double EWMA control chart for the individuals based on a linear prediction. Journal of Modern Applied Statistical Methods,16(2), 443-457. https://doi.org/10.22237/jmasm/1509495840
Robert, S. W. (1959). Control chart tests based on geometric moving average. Technometrics, 1, 239-250.
Shamma, S. E., & Shamma, A. K. (1992). Development and evaluation of control charts using double exponentially weighted moving averages.International Journal of Quality & Reliability Management, 9(6), 18.https://doi.org/10.1108/02656719210018570
Woodall, W. H. (1984). On the markov chain approach to the two-sided CUSUM procedure. Technometrics, 26,41-46. https://doi.org/10.2307/1268414
Downloads
Published
License
Copyright (c) 2023 Journal of Applied Science and Emerging Technology

This work is licensed under a Creative Commons Attribution-NonCommercial-NoDerivatives 4.0 International License.

