The Modeling Shape Parameter of The Generalized Extreme Value Distribution of Rainfall-Runoff with Satellite Images by Using Artificial Neural Network Approach
Keywords:
Generalized Extreme Value, Artificial Neural Network, Runoff, Normalized Difference Vegetation Index, RainfallAbstract
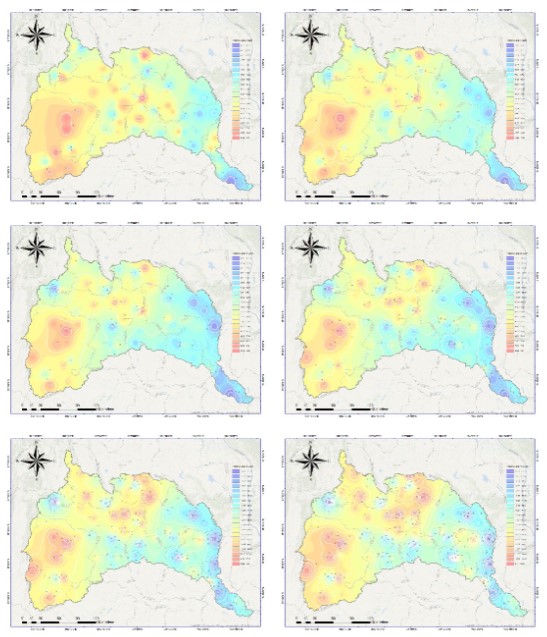
The main objective of this research is to determine the variables that affect the shape parameter change by considering the correlation coefficient and to model the shape parameter under a generalized extreme value (GEV) distribution to predict flood risk areas with a return level map. The researchers collected satellite, meteorological and hydrological data of the Chi River Basin over the past 11 years (2010 to 2021) from the Thai Meteorological Department (TMD) and agricultural stations, a total of 92 stations. In our study, the shape parameter was estimated with non-stationary process by artificial neural network (ANN) approach and stationary process by maximum likelihood estimation (MLE) approach under GEV distribution. The Nash-Sutcliffe coefficient (NSE) is used to compare the two models. The study found that the non-stationary model was suitable for the monthly maximum rainfall data of 59 stations, categorized into the ANN-7 model of 17 stations, the ANN-10 model of 27 stations and the ANN-3 model of 15 stations. In the case of a fixed model, it is suitable for all 33 stations of monthly maximum rainfall data. When looking at the overview of the mean NSE of each model, the NSE was greater than 0.75, concluding that the model occurring at each of the 92 stations were appropriate for the monthly maximum rainfall data and the models had predictive accuracy. At the end of the study, the return level of monthly maximum rainfall data in various return periods were presented through a 2D map.
Downloads
Published
License
Copyright (c) 2022 The Journal of Applied Science

This work is licensed under a Creative Commons Attribution-NonCommercial-NoDerivatives 4.0 International License.

