Fuzzy Cumulative Sum Control Chart for Monitoring Fuzzy Process
Keywords:
Cumulative Sum Control Chart, Fuzzy Cumulative Sum Control Chart, Average Run Length, Normal DistributionAbstract
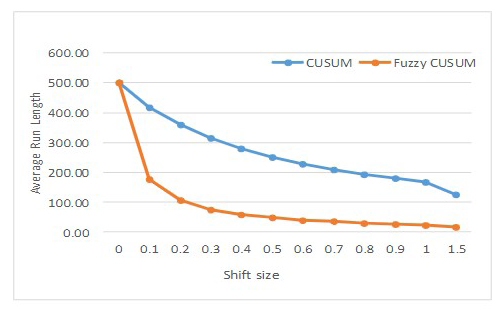
Today's market competition is increasing rapidly, product quality control is essential for manufacturers to maintain mass-produced products with low production costs and high quality. Therefore, statistical process control (SPC) tools for manufacturing processes are becoming more emphasized because their effectiveness of the control chart is to reduce the variability of the quality characteristic. The cumulative sum (CUSUM) control chart was developed to detect a small shift in the process mean. In this paper based on the fuzzy set theory, we develop a fuzzy CUSUM control chart, namely a Fuzzy CUSUM control chart to accommodate the fuzzy situation where the fuzziness of vague sample data is taken into consideration. The CUSUM control chart and Fuzzy CUSUM control chart are used to control and monitor the mean of a process. The objective of this paper is to compare the ability and performance of the existing CUSUM control charts and the proposed fuzzy CUSUM control chart to detect shifts in a process. These data are generating by the Monte Carlo Simulation technique. The criteria to evaluate the performance of the control chart is called average run length in a situation process that goes out-of-control. The result of the comparison shows that the Fuzzy CUSUM control chart is more sensitive than the CUSUM control chart in the case of a process that has small shifts in the mean.
Downloads
Published
Issue
Section
License
Copyright (c) 2021 The Journal of Applied Science

This work is licensed under a Creative Commons Attribution-NonCommercial-NoDerivatives 4.0 International License.

