Efficiency comparison of control charts for monitoring a positive mean shift in Poisson process
Keywords:
control chart, Poisson distribution, positive mean shiftAbstract
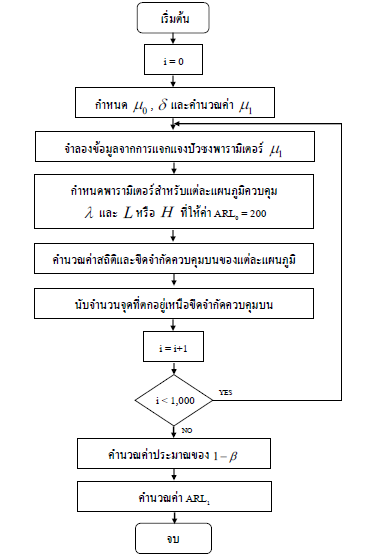
Attribute control chart is a common statistical tools used to monitor number of defects or nonconformities in a manufacturing process, considered as count data and are Poisson distributed. The nonconformities are count data and are Poisson distributed. In this study we compare the performance of PCUSUM, PEWMA, ISRT c EWMA and PPM charts for detecting a positive mean shift in Poisson process. The plotting statistics are adjusted for monitoring a positive shift. The performances of control charts are evaluated by measuring the average run length when the process is out of control (ARL1). The results reveal that the PCUSUM chart performs well to detect a small shift in Poisson process with low process average. PPM chart outperforms than the others for detecting small to moderate shifts, whereas PEWMA ( = 0.1) and ISRT c EWMA perform better than the others to detect a large shift.
Downloads
Published
Issue
Section
License
Copyright (c) 2021 The Journal of Applied Science

This work is licensed under a Creative Commons Attribution-NonCommercial-NoDerivatives 4.0 International License.

