Robustness of CUSUM-Tukey’s Control Chart for Detecting of Changes in Process Dispersion
Keywords:
dispersion, nonparametric control chart, monitoring, Monte Carlo simulationAbstract
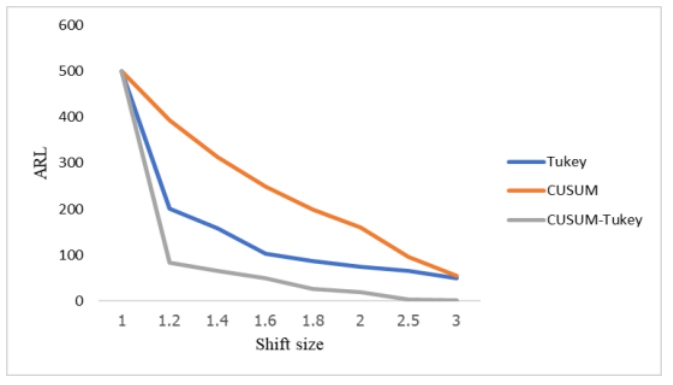
The aims of this research have investigated the robustness of Cumulative Sum – Tukey’s control chart (CUSUM-Tukey) to detecting process dispersion when the assumption of process distribution has deviated from the normal distribution. The performance of control charts is commonly measured by an out of control Average Run Length (ARL1) by given in control Average Run Length (ARL0) = 370 and 500. The performance of CUSUM-Tukey is compared with Tukey’s control chart (Tukey) and Cumulative Sum control chart (CUSUM) where the best performance of the control chart will give the minimum value of ARL1. The numerical results are figured out by the Monte Carlo simulation method to approximate ARL which found that the CUSUM-Tukey chart is superior to Tukey and CUSUM control charts for all case studies of distributions and several spans for calculating moving range.