Evaluation of corrosion failure of lacquer coated food can by electrochemical and microscopic method
Keywords:
lacquer coated steel, potentiostatic technique, microscopeAbstract
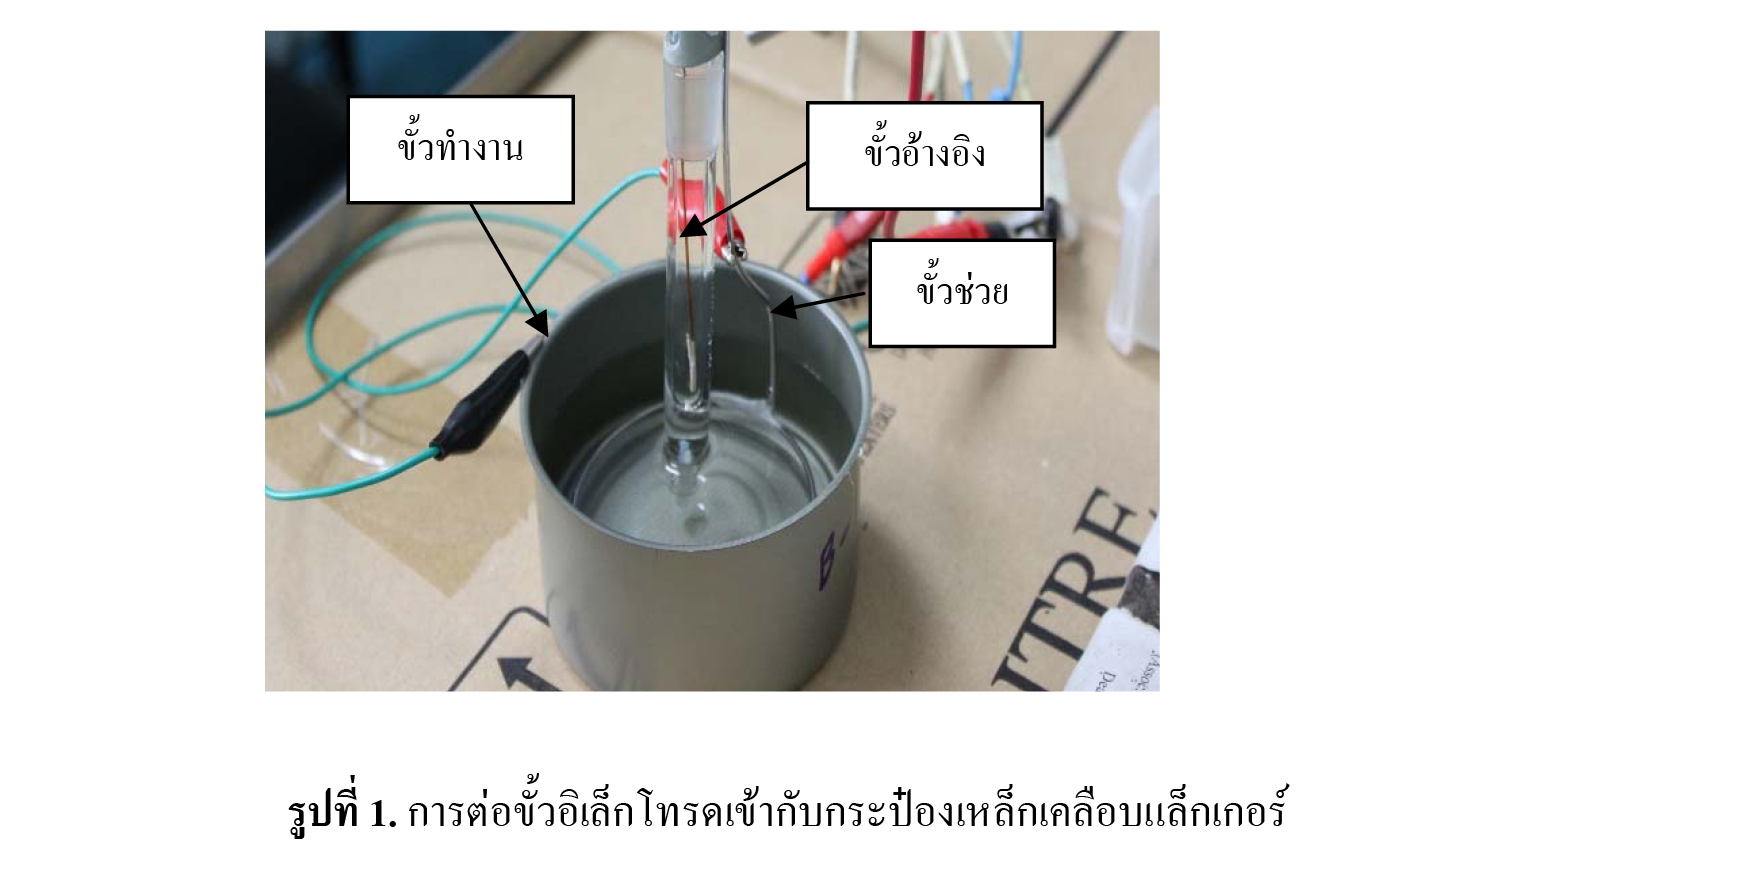
Lacquer coated steel can is widely used for different types of food e.g. sea-food and fruit. Thus, can factories have to inspect the quality of lacquered can for corrosion resistance on surrounding food. For this purpose electrochemical technique was used to accelerate corrosion process by DC voltage. 6V potential was applied for 10 seconds to lacquered can containing different kinds of solutions i.e., 2%w/w NaCl, 2%w/w NaOH, 2%w/w citric acid and 2%w/w , respectively. Lacquered can which could not endure the solution at high voltage would corrode. Failure of lacquered can could be analyzed quantitatively from the amount of maximum currents and total amount of charges (current time) released. Current was potentiostatically plotted against time and calibration curve was made from maximum of the dissolution currents and charges of different sites of wires in various solutions. Corrosion currents and charges of dissolved wires were plotted against corroded area on the calibration curve. Lacquered cans from factory were tested and it was found that the currents were in the range of 10-1700 µA. The results showed that these cans were in good conditions and least or no corrosion was found. Food cans were purchased from supermarket and were tested in similar ways. Maximum currents and charges were determined and calculated as corroded areas. When compared the outcome from calibration curve with the result from microscope, it was evidently revealed that corroded areas calculating from optical microscope images were under estimated which were a little bit lower than those calculated from calibration curves of maximum currents and charges [evaluated values from microscope were 0.3847, 0.0891, 0.096 and 0.2829
compared with 1.143, 0.246, 0.108 and 0.269
, respectively, which were evaluated from maximum current for sardines in tomato sauce (Three brands) and salted mixed vegetables].