Performance measures of single-level continuous sampling plans for short production runs
Keywords:
performance measures, single–level continuous sampling plans, short production runsAbstract
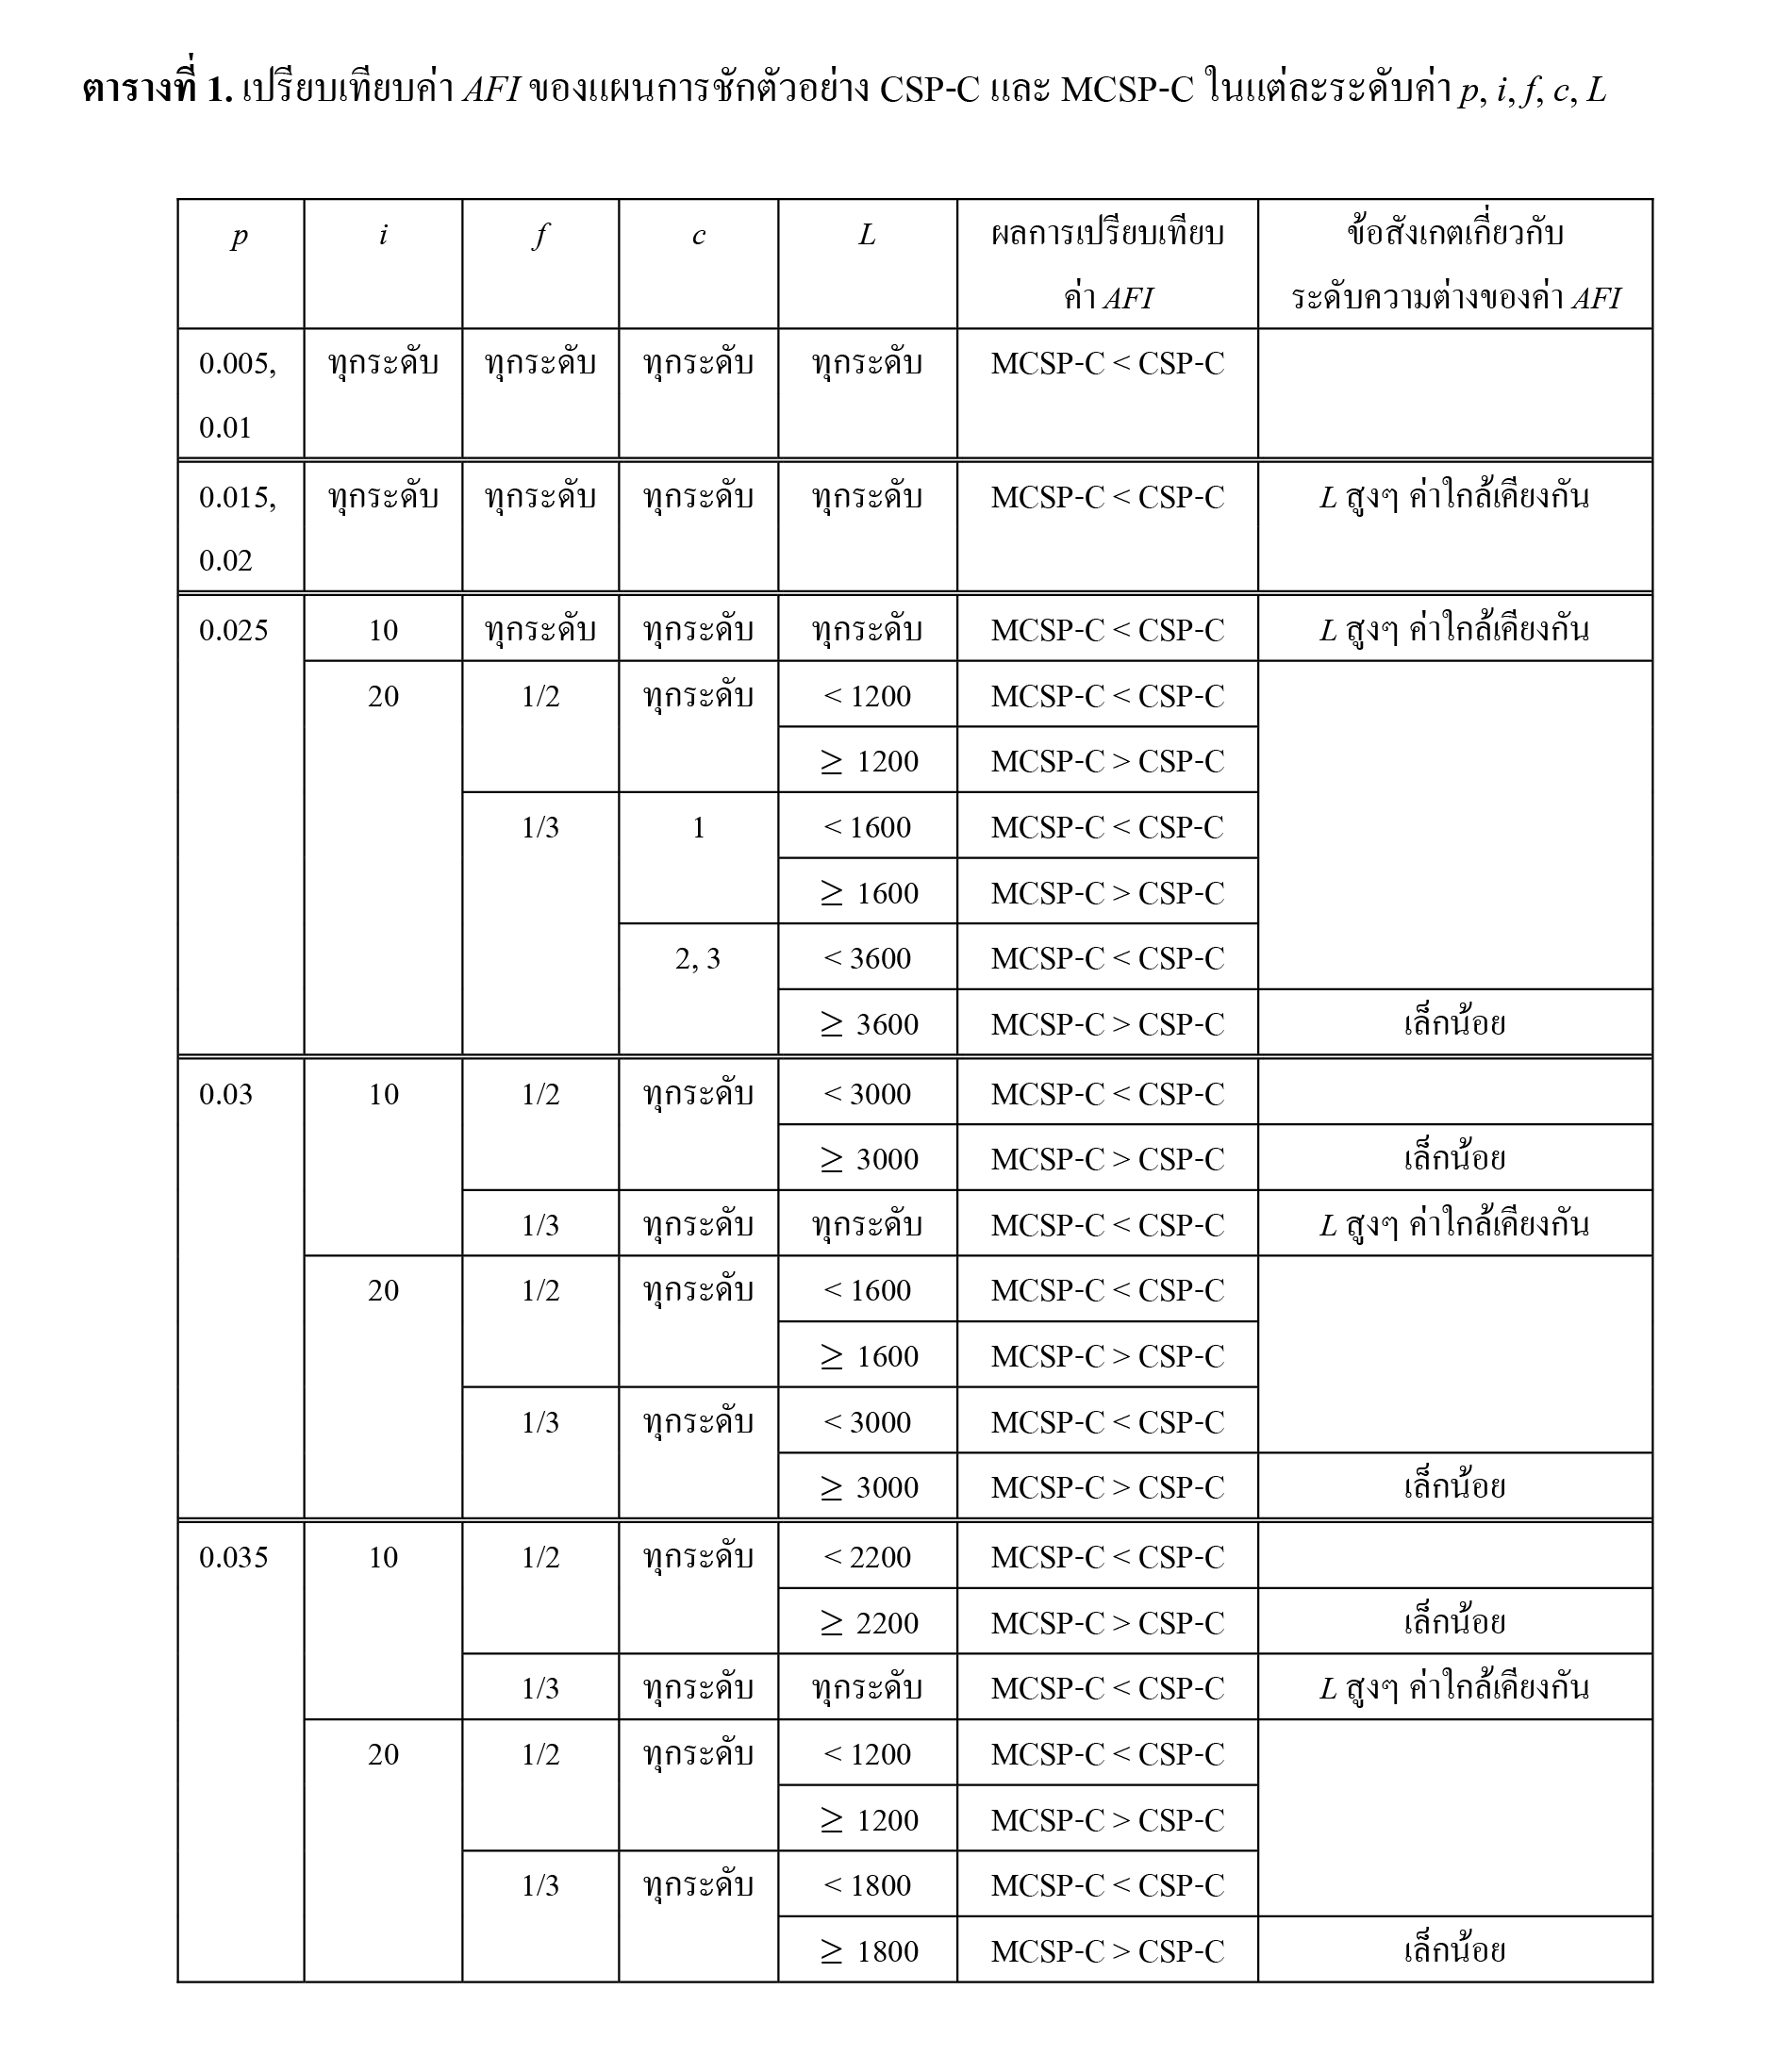
This research compared the performance measures of the two continuous sampling plans: CSP-C (generalized CSP-C) and MCSP-C (modified CSP-C). The average fraction inspected (AFI) and the average outgoing quality (AOQ) were the performance measures to be used. Simulations was carried out and inspected with C and R program for different levels of five following parameters: 21 levels of lengths of the production line (L), 7 levels of fractions of defective units on the line (p), 2 levels of the number of consecutive non-defective units to be found during a 100% inspection of units (i), 2 levels of fractional inspection of units (f) and 3 levels of maximum allowable number of nonconforming units in sampling fractions (c). The number of conforming units to be found before allowing c non-conforming units in the sampling inspection was also simulated for the MCSP-C continuous sampling plans (m=i). The results showed that the AFI values of MCSP-C were lower than the CSP-C in the case of the low levels of p (p=0.005, 0.01, 0.015, 0.02) for all sets of L, i, f and c. At high level of p (p=0.025, 0.03, 0.035) and for a short range of L, the AFI values of MCSP-C were lower than the CSP-C. For a long range of L, the AFI values of MCSP-C were a little higher than the CSP-C. The results for the AOQ values indicated that the AOQ values of CSP-C were lower than the MCSP-C at the low levels of p (p=0.005, 0.01, 0.015, 0.02) for all sets of L, i, f and c. At high levels of p (p=0.025, 0.03, 0.035) and short range of L, the AOQ values of CSP-C were lower than the MCSP-C. For the high range of L, the AOQ values of CSP-C were greater than the MCSP-C.