Study of Solar Wind Parameters During Geomagnetic Storm of 26th August 2018 and 28th September 2017
Keywords:
Solar wind, Geomagnetic storms, SYM-H, Cross-correlation, Wavelet analysisAbstract
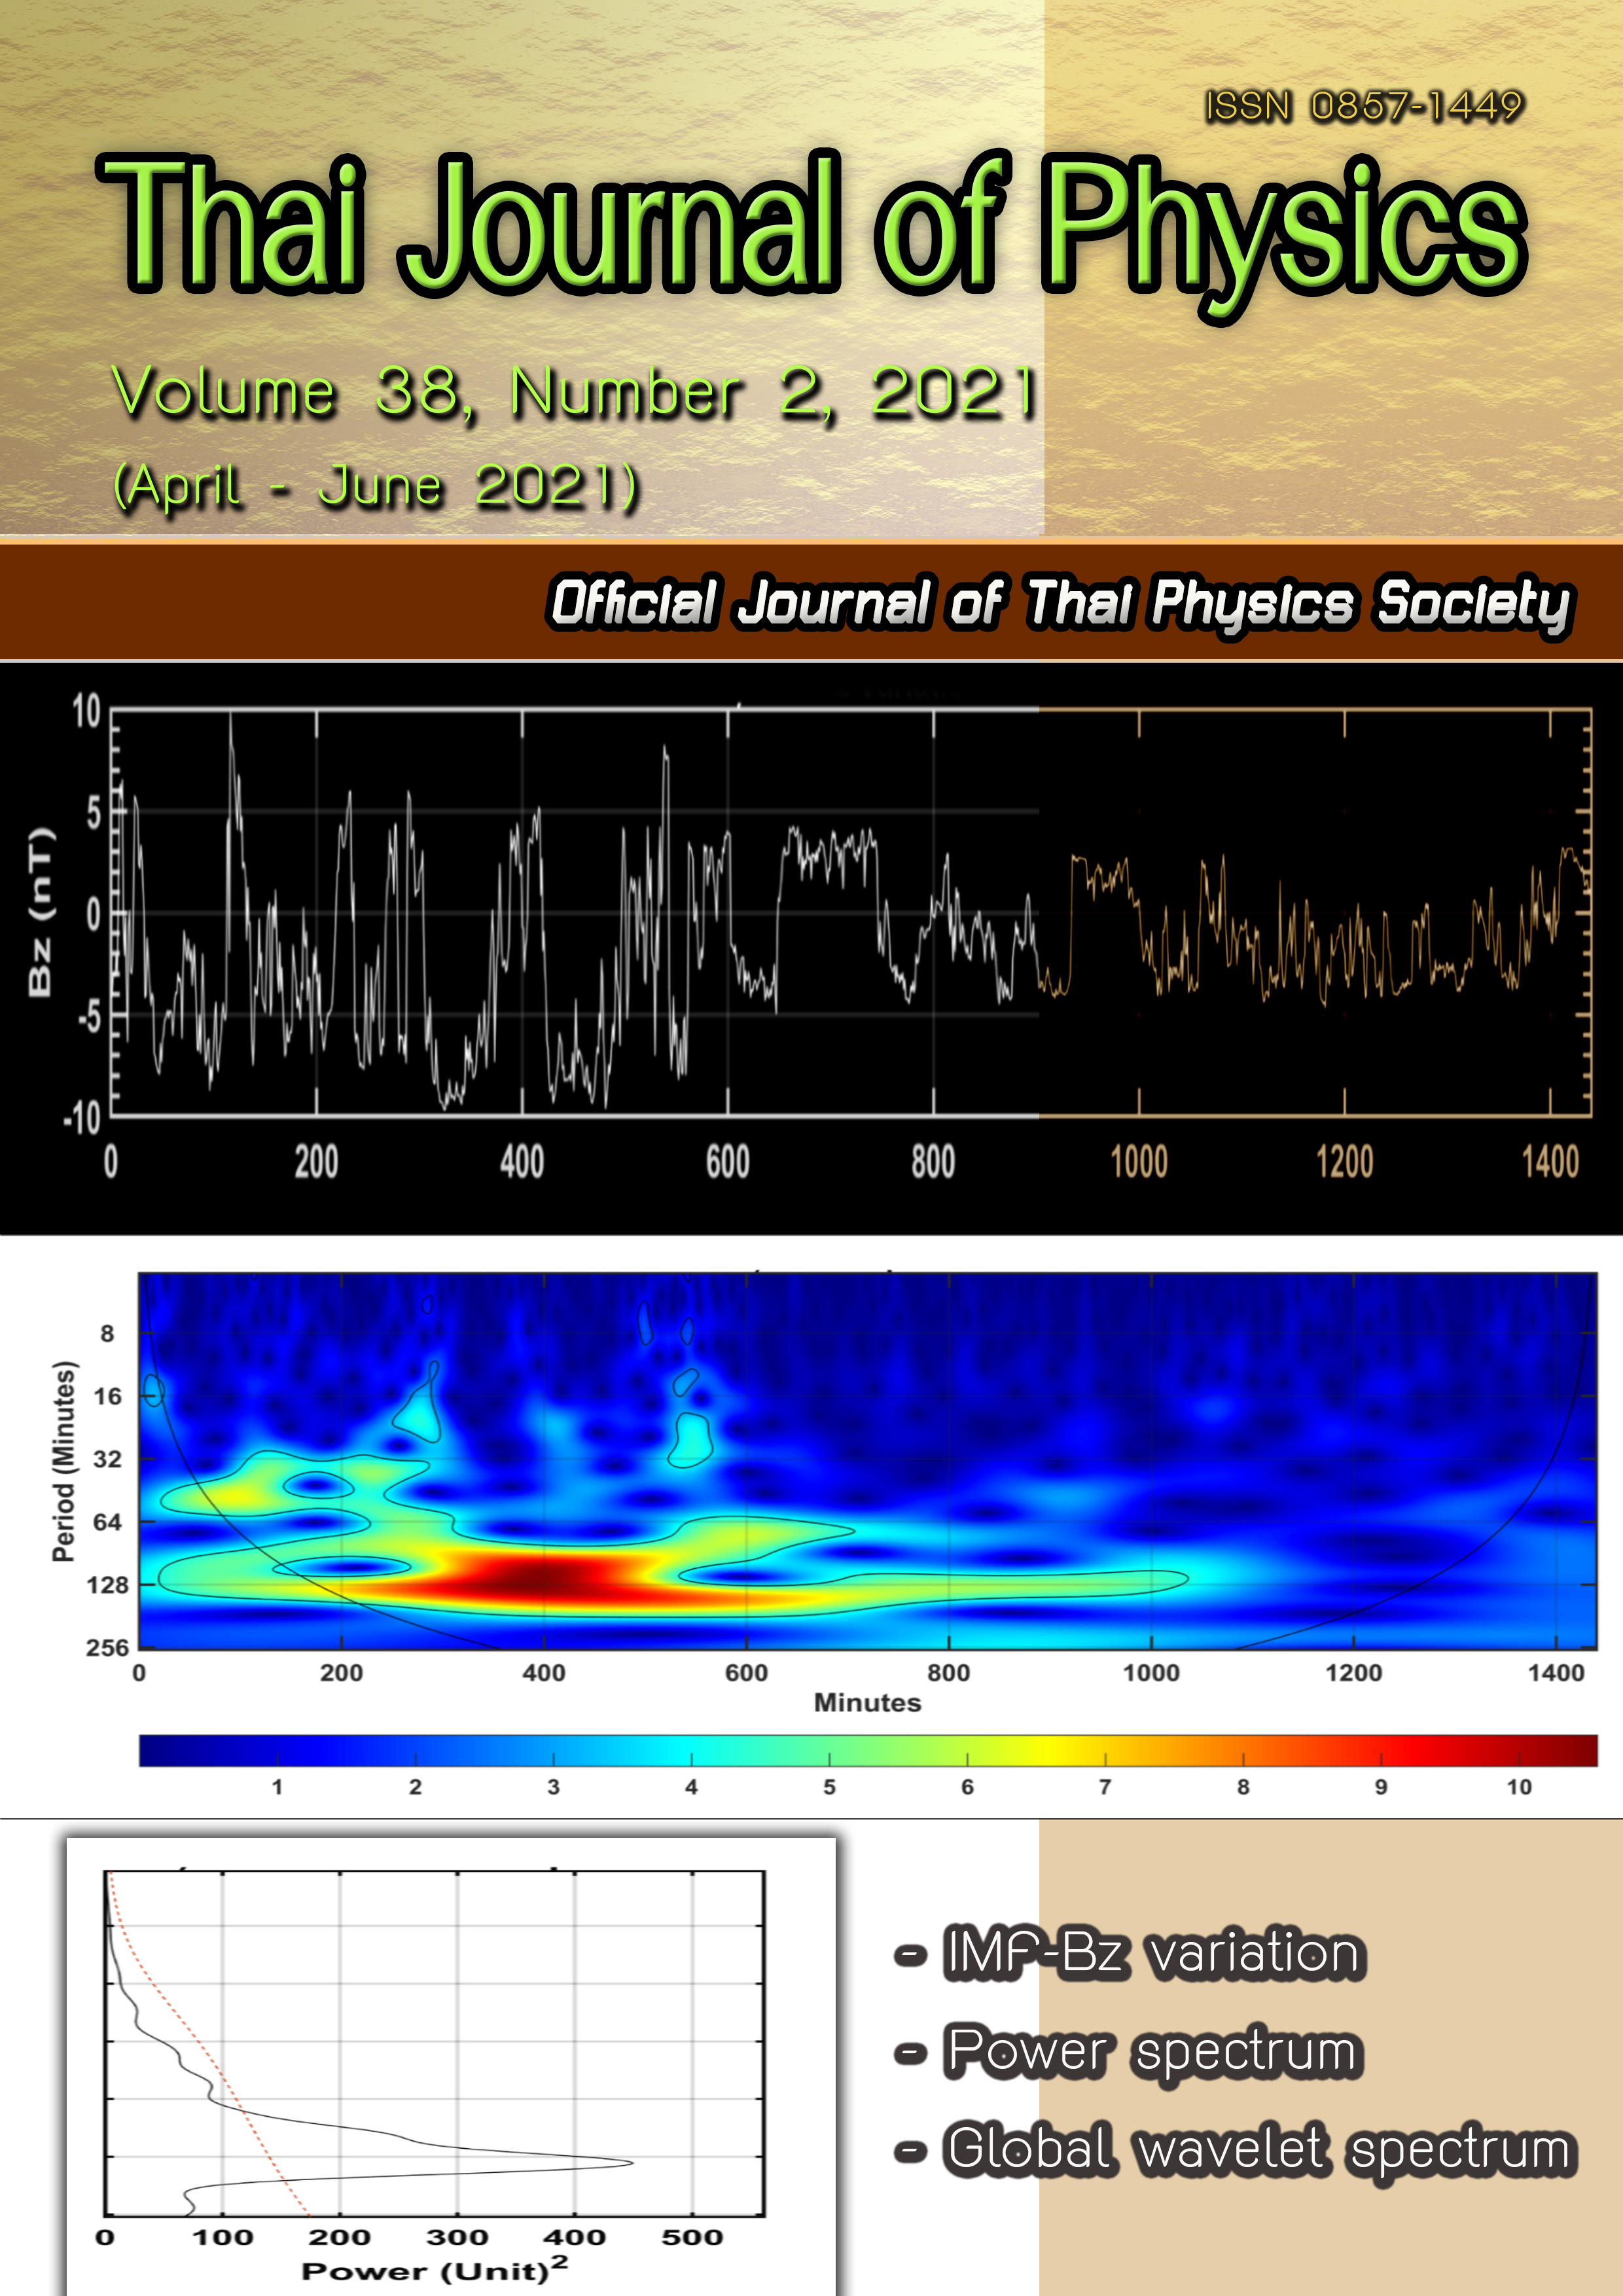
In this paper, we have studied solar wind parameters, interplanetary magnetic field (B), solar wind speed (Vsw), solar wind density (Nsw), solar wind temperature (Tsw), and the south-north components of magnetic field Bz, By and Bx and geomagnetic index, SYM-H during the geomagnetic event of 27th – 29th September 2017 and 25th – 27th August 2018 using OMNI data. These parameters play a vital role in a better understanding of geomagnetic storms. The selection of the events has been made by using the equatorial index, the SYM-H index. In our work, during the moderate geomagnetic event of 27th-29th September 2017, we observed a sudden change in the magnetic field, which is evident from the minimum value of Bz (-8 nT). With the SYM-H index, we noticed sudden commencement around 00:30 UT, and it falls to a minimum value (-74 nT) with a couple of local minima. Similarly, during the intense geomagnetic event of 25th – 27th August 2018, Bz turns northward, reaching a value of -16.22 nT, and the SYM-H index decreased and reached the minimum value of -206 nT, and the Bz changed its polarity several times at different phases of the storm. For more illustration, we have used cross-correlation and wavelet analysis techniques. Cross-correlation analysis presented the strong negative association of SYM-H with Vsw, Nsw, Tsw, By, and B at a 0-min time lag. On the other hand, SYM-H shows a strong positive correlation with Bx at zero-time lag, and for Bz, it shows poor association with a very low correlation coefficient. Moreover, the CWT has revealed to be an effective tool in the time localization of the interplanetary magnetic field component (Bz) parameters, and it may be the most convenient to represent times series with abrupt variations or steps, i.e., very small and localized variations as the discontinuities in the provided signal used for the study.


